VERSION HISTORY
LIRA-FEM
Analysis Results
Tools for evaluation of object properties and analysis results
- New mosaic plots have been implemented:
- Mosaic plots of effective lengths of reinforced concrete bars and plates (walls) relative to the local axes Z1 and Y1;
- Mosaic plots of cross-sectional classes for checking and selecting transverse steel sections for DBN V.2.6-198:2014 "Steel Structures".
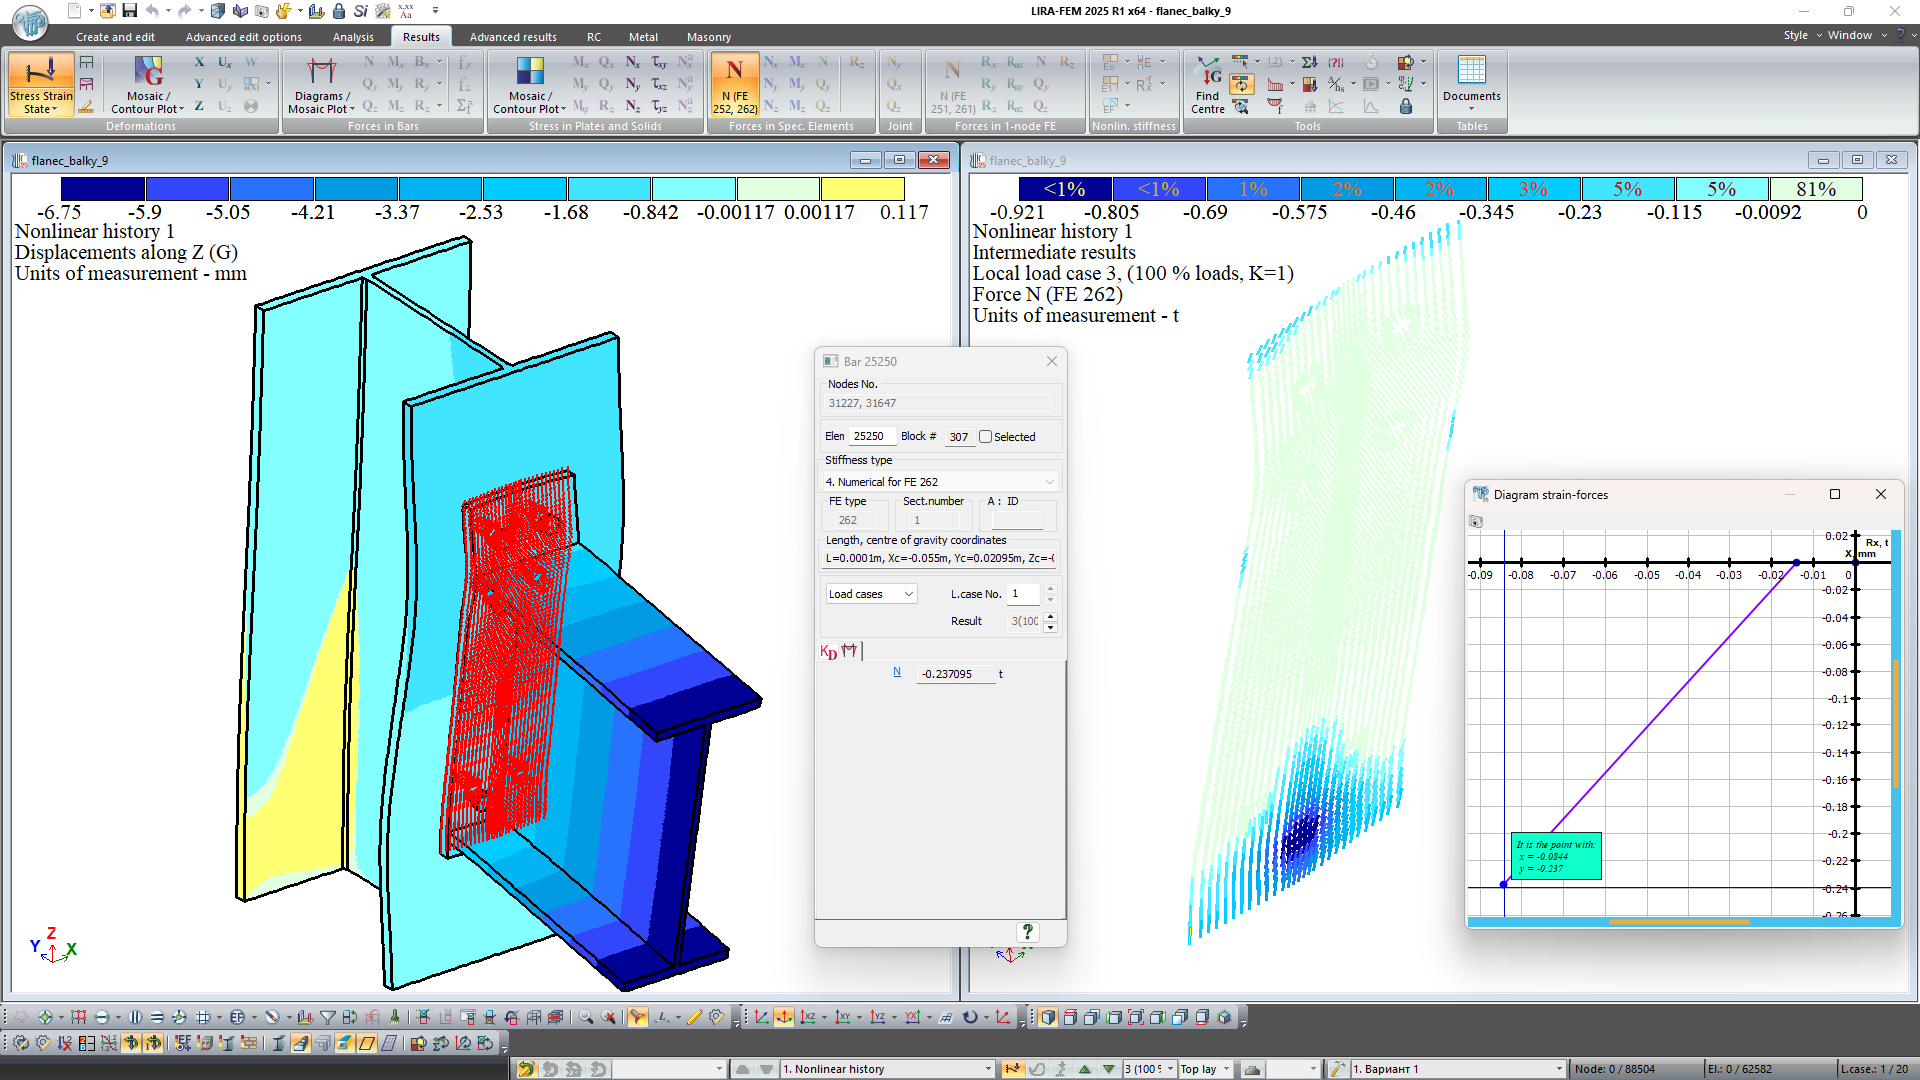
- Graphs can now be plotted for two-node and one-node special elements (FE of elastic springs: 51, 55, 56; 1-node FE of one-way spring with account of ultimate force: 251, 252, 255, 256; 1-node FE of one-way elastic spring with a gap between the structure and the spring: 261, 262, 265, 266; 1-node one-way FE of friction with a gap and accounting for friction between the structure and the spring: 263, 264).
-
It is now possible to save the "strain-force" diagrams for the special FEs in CSV format.
- A new cross-section type "Round Tube" has been added for specifying aluminum sections of bars using the aluminum database.
Other features analysis results
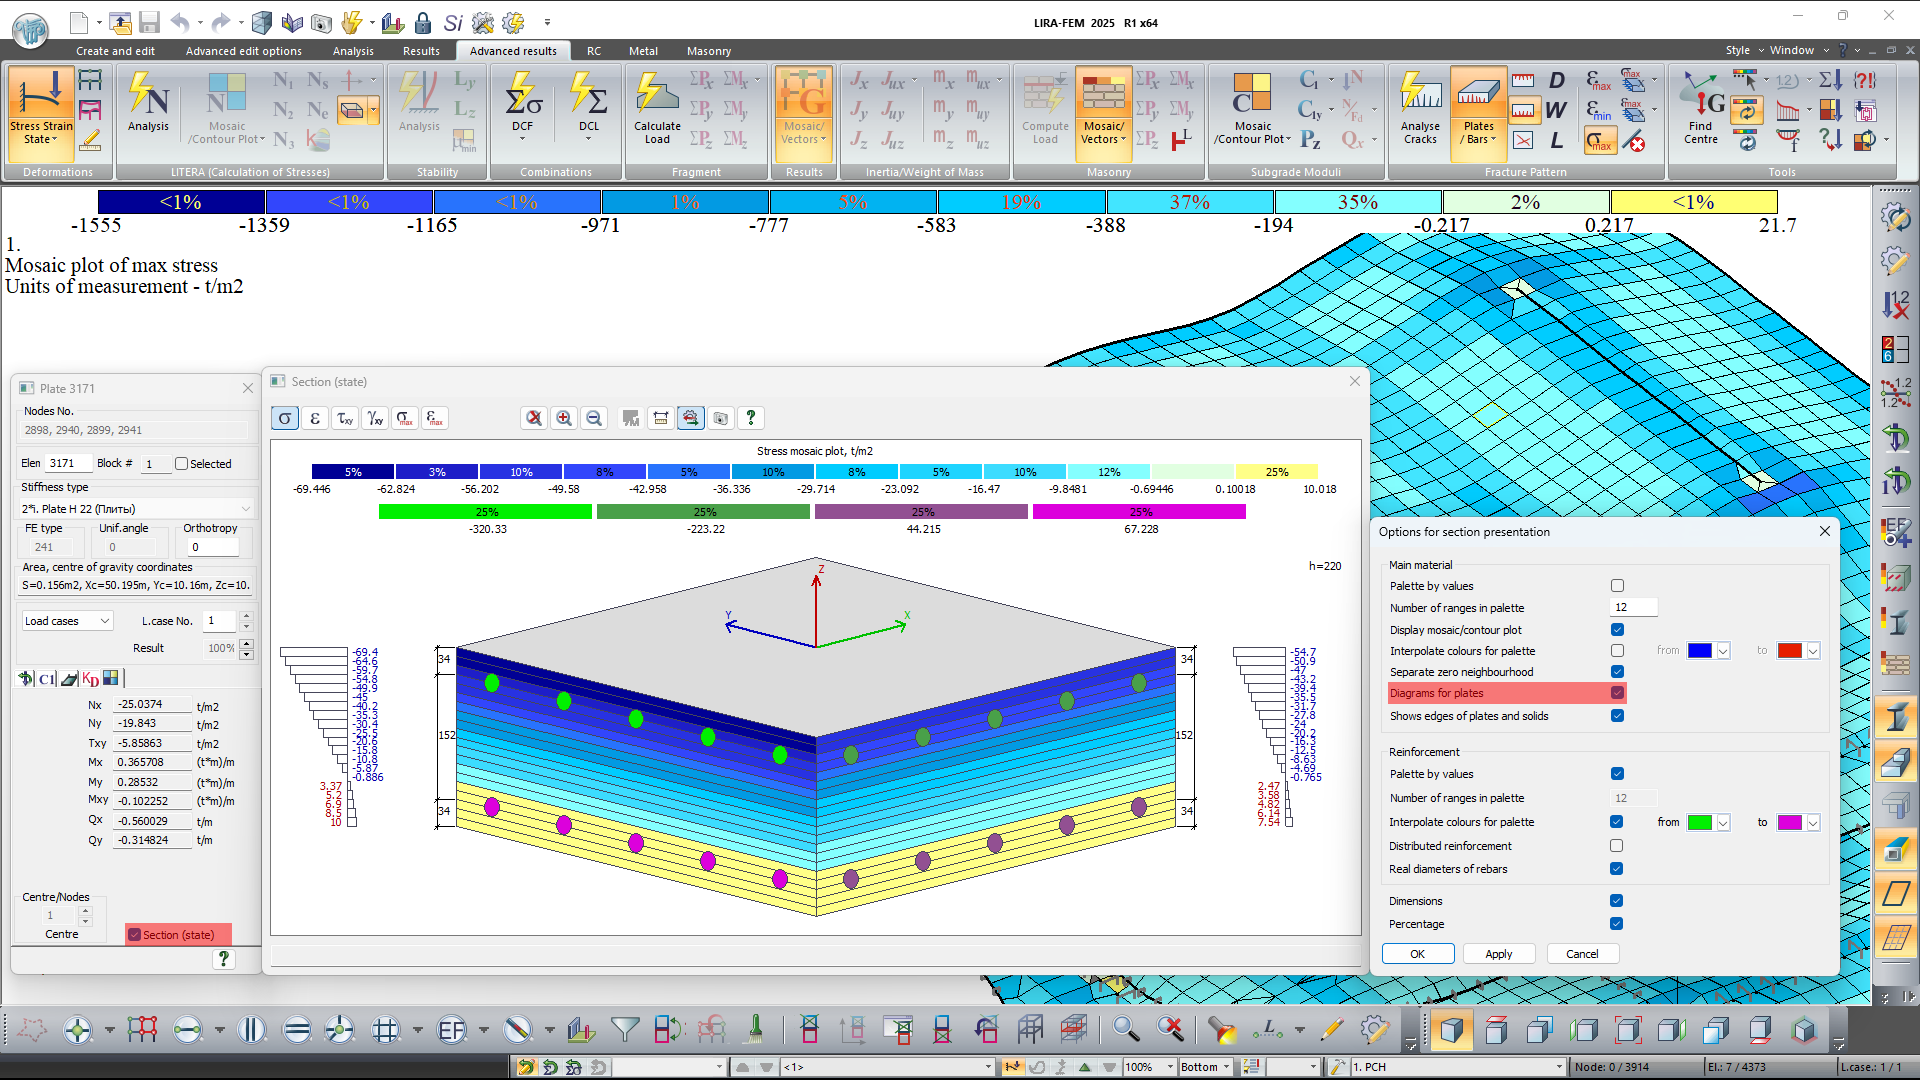
In the "State of the section" window for physically nonlinear iterated plates, it is possible to display stress and strain diagrams with indicated values for each elementary strip of the section.
New mosaic plots are implemented:
- Group of mosaic plots of total stiffnesses Rx, Ry, Rz in pile caps.
- Mosaic plot of the stability analysis results for the universal bar in metal elements, % of load-bearing capacity for Eurocode 3 EN 1993-1-1:2005/AC:2009, SP RK EN 1993-1-2:2005/2011.
- A group of mosaic plots for evaluating the input data of the problems in which the erection process was modelled (mosaic plots of assembled and disassembled elements at each assemblage stage, mosaic plot for No. of assemblage groups of elements, mosaic plot of correction factors to the modulus of elasticity and to the concrete strength at each assemblage stage for each group of elements).
- A group of mosaic plots for angles between the local axis of nodes and the global axis along selected directions.
- Mosaic plot for numbers of the specified groups of loads on fragment (the groups that contain the node).
- Mosaic plots for element sensitivity parameters to buckling.
- Mosaic plot for the direction of displacement in mass application.
- Mosaic plot for selected cross-sections of metal structures.
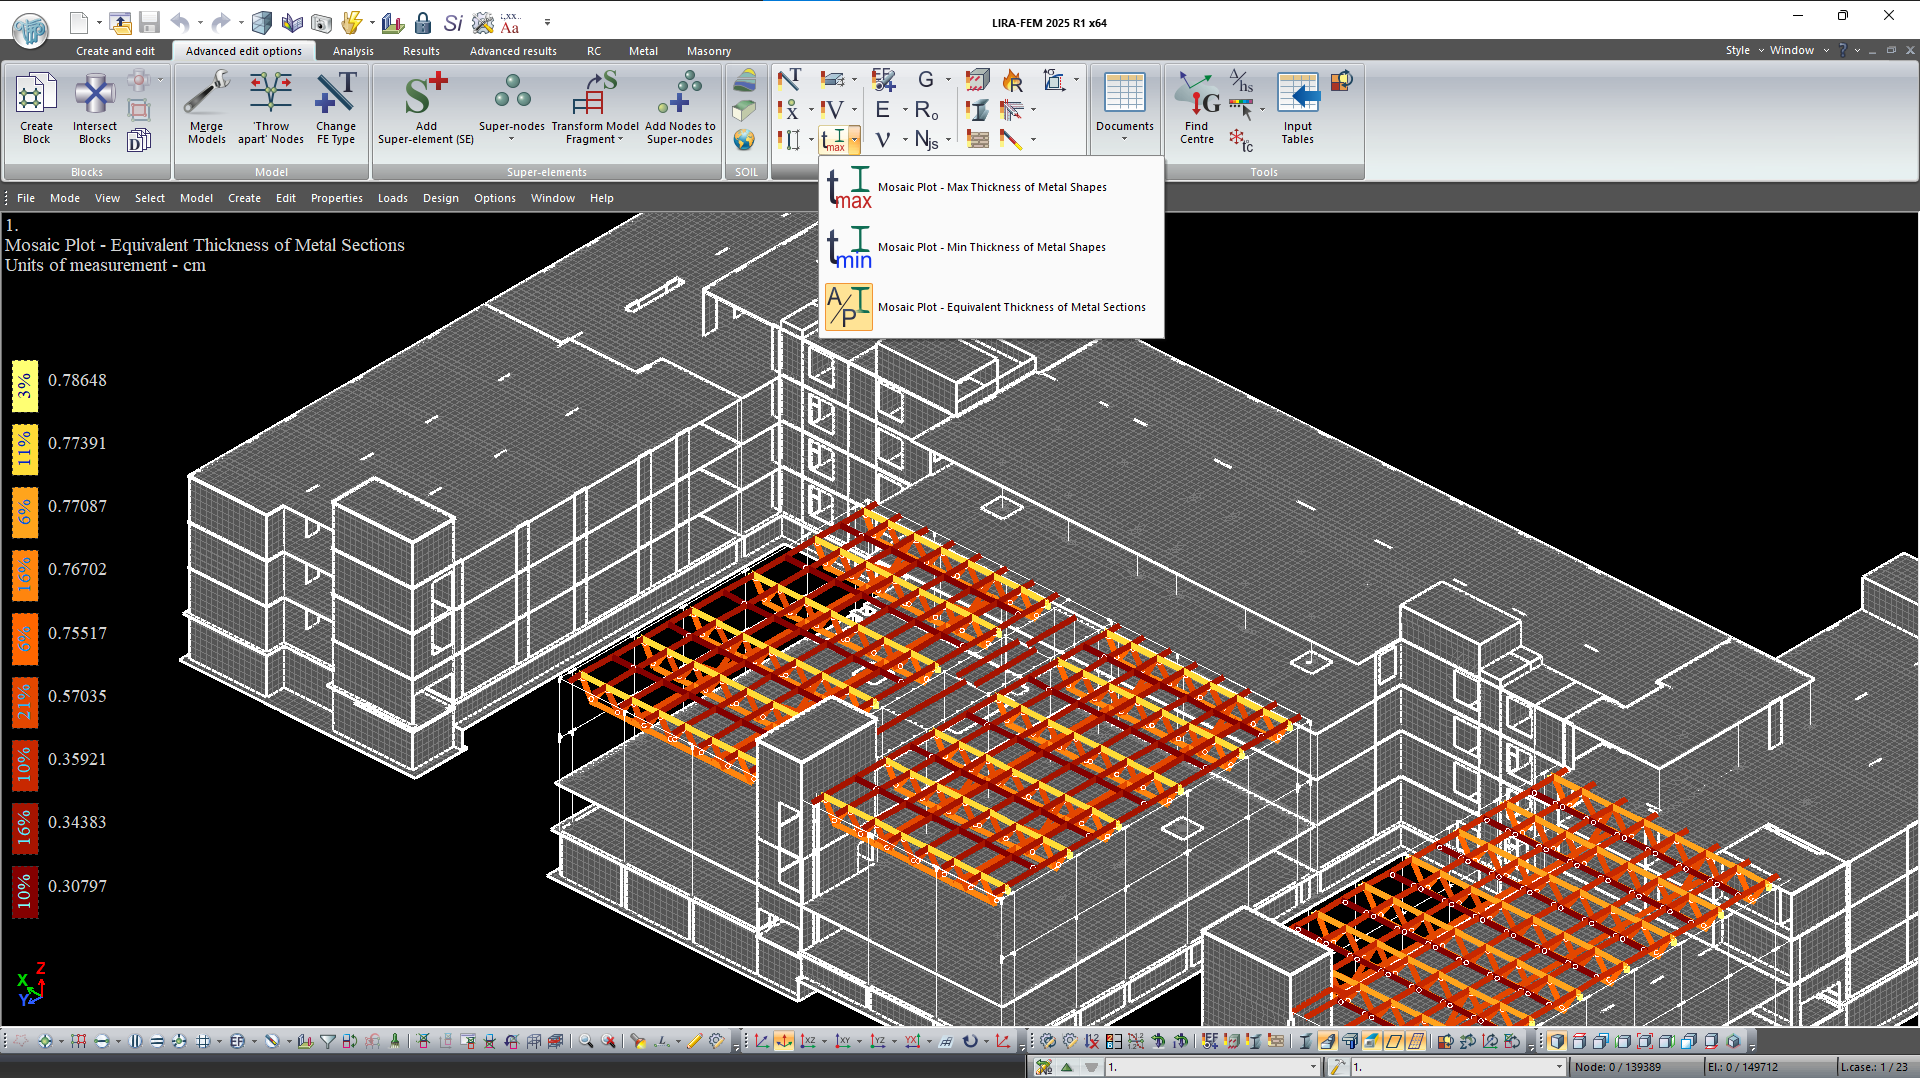
- Mosaic plot for the reduced thickness of metal sections (ratio of the cross-sectional area to the length of the perimeter of the section).
The Diagram for floor slab stiffness is generated for floor slabs both from plates and bars. The diagram is designed to classify the stiffness of the slab disc in its plane, %, according to paragraph 2.2.2.5.4 (f-la. 2.2 and 2.4) of NTP RK 08-01.2-2021 (to SP RK EN 1998-1:2004/2012) "Design of earthquake-resistant buildings".
The scale settings now contain an option that allows you to place scale labels on a transparent background.
In modes of displacement contour plots for bars, it is possible to present displacements at nodes.
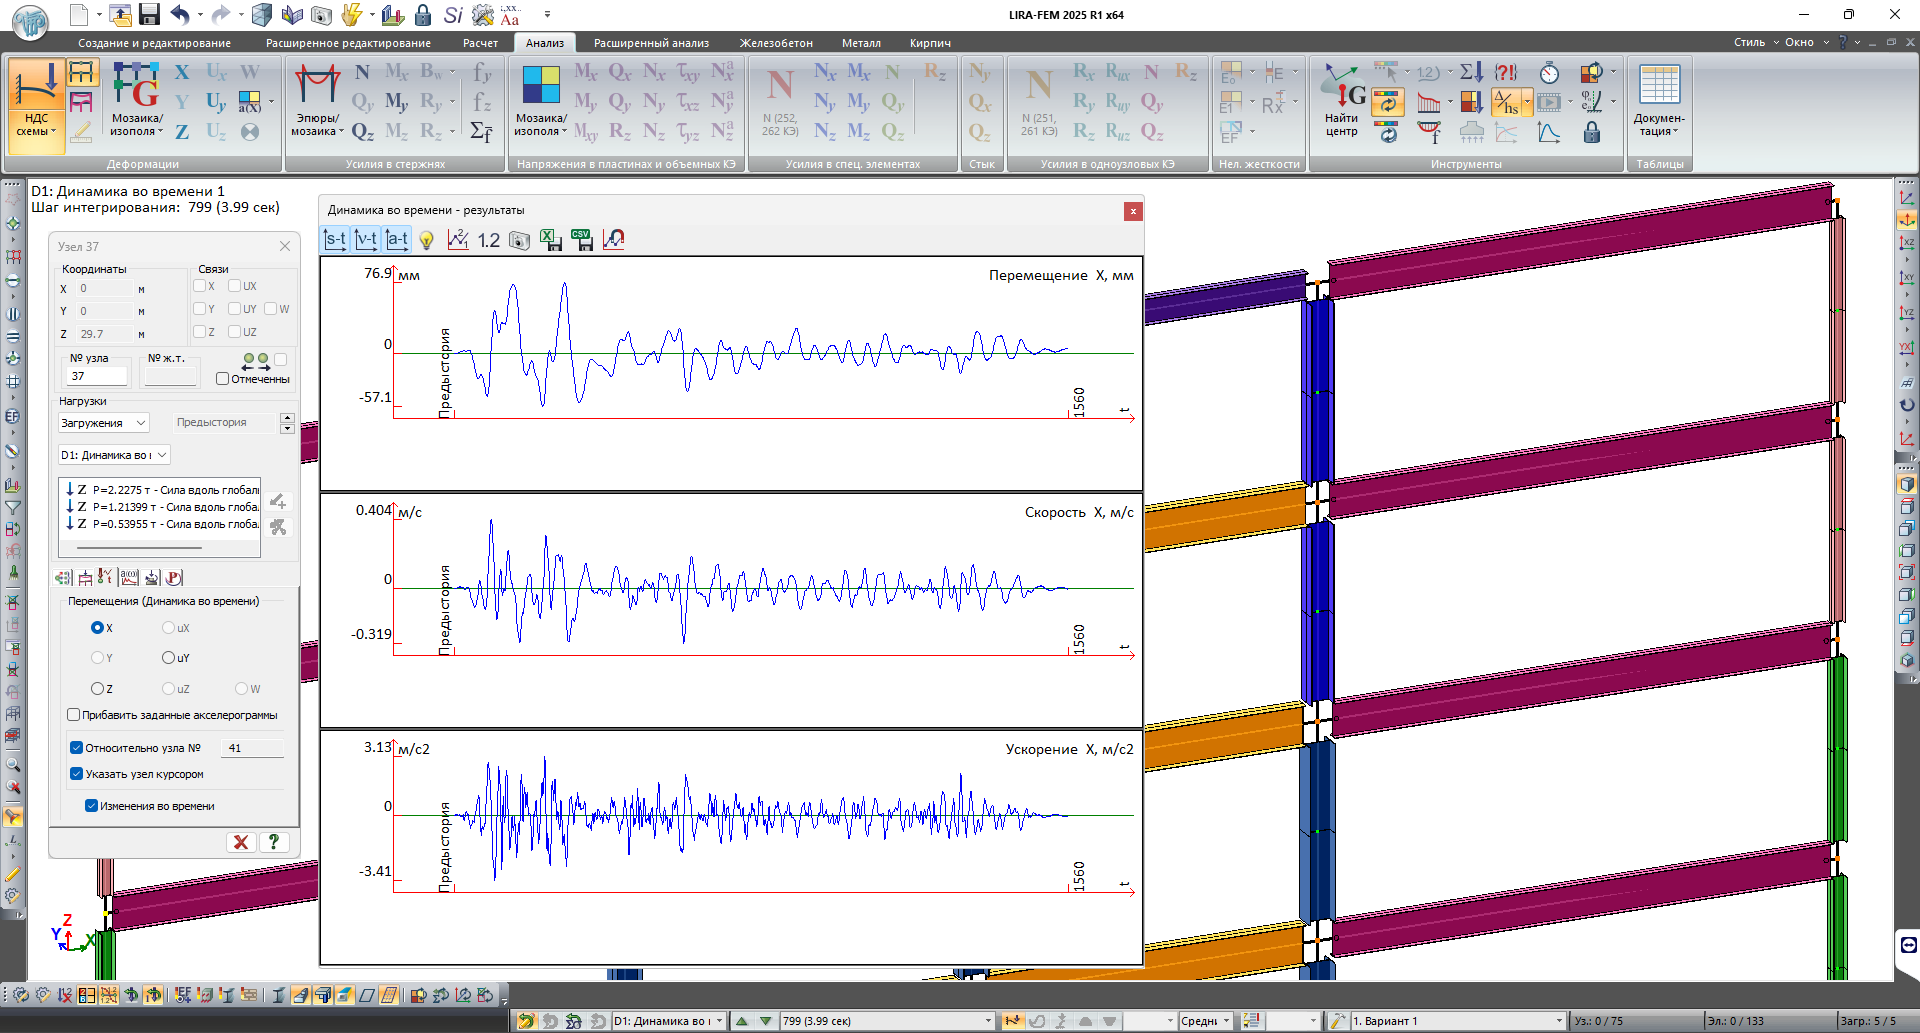
To generate the graph of nodal displacements in the time history analysis, the user could define the number of nodes relative to which the displacements are recalculated.
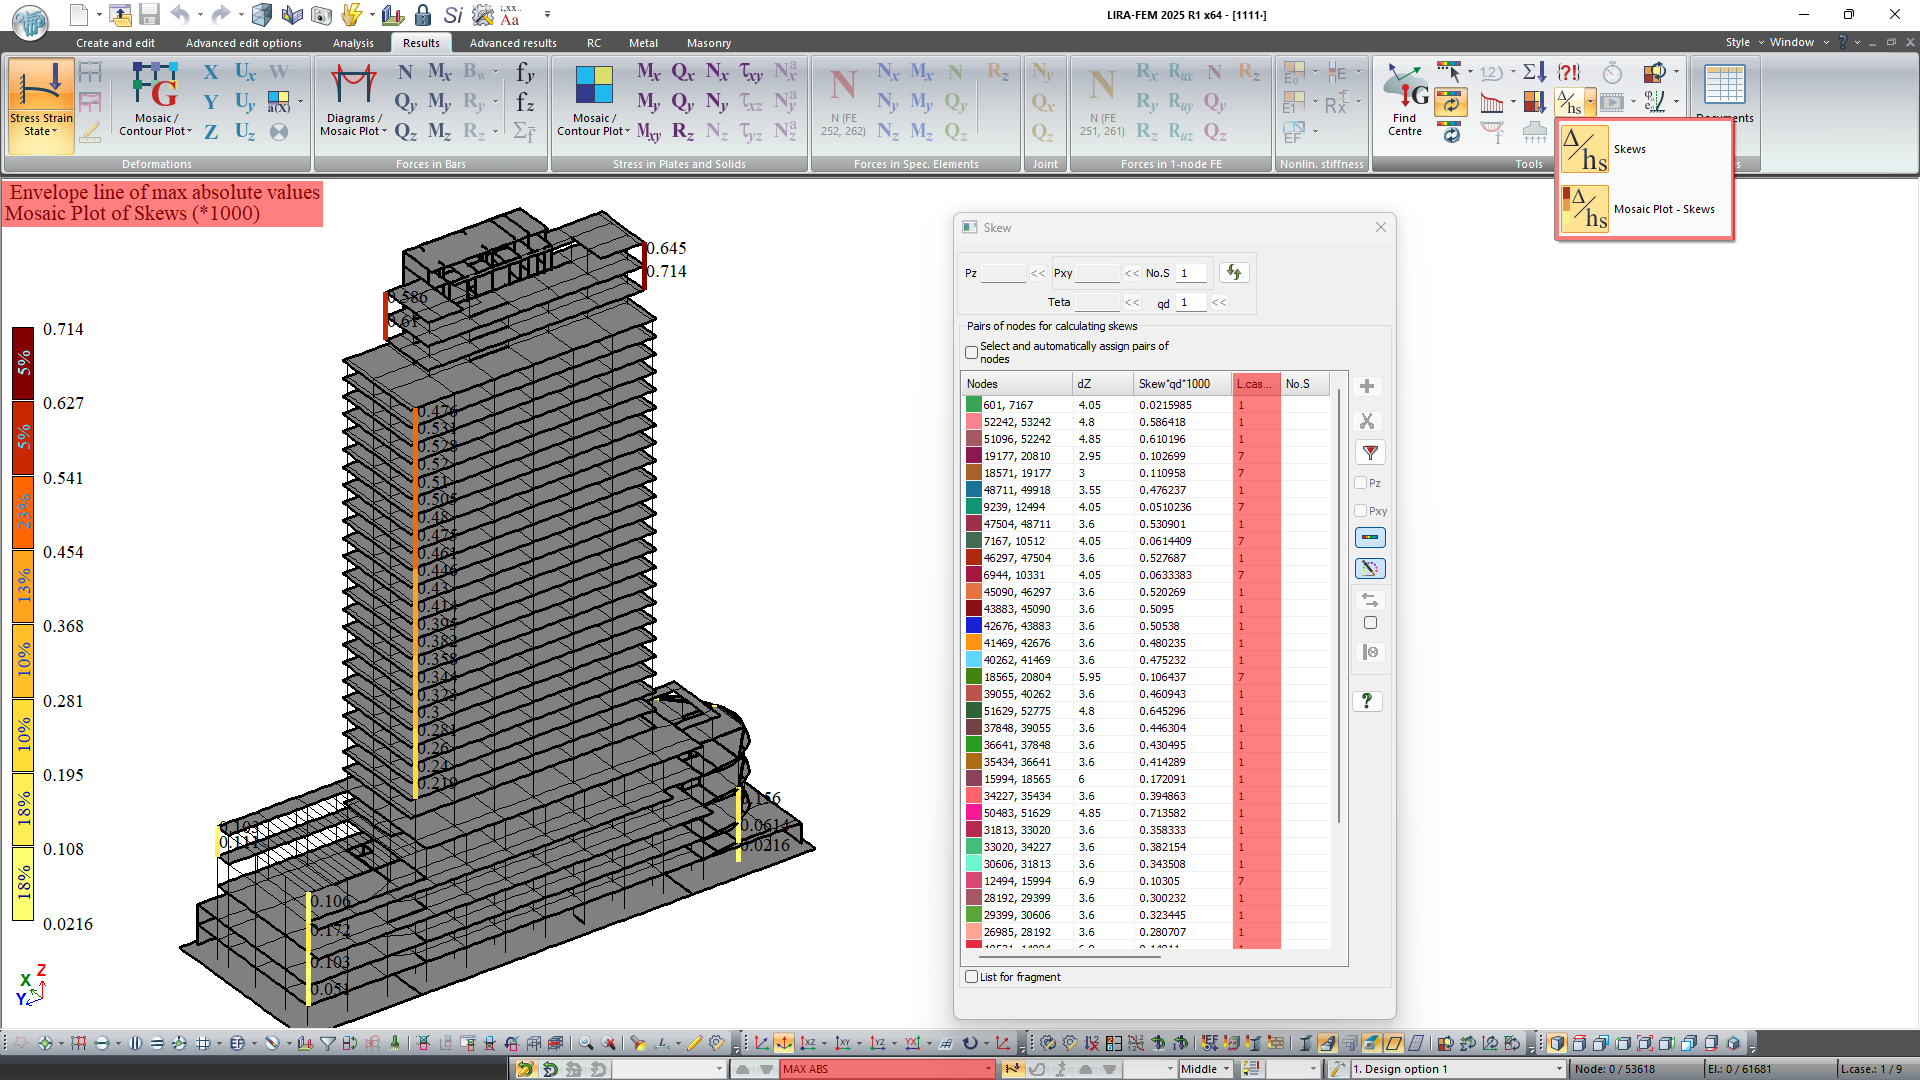
The envelope diagrams (by max, min and absolute values for load cases and DCL) may be generated for structural skews and displacement diagrams (Fz, Fy) of bars.
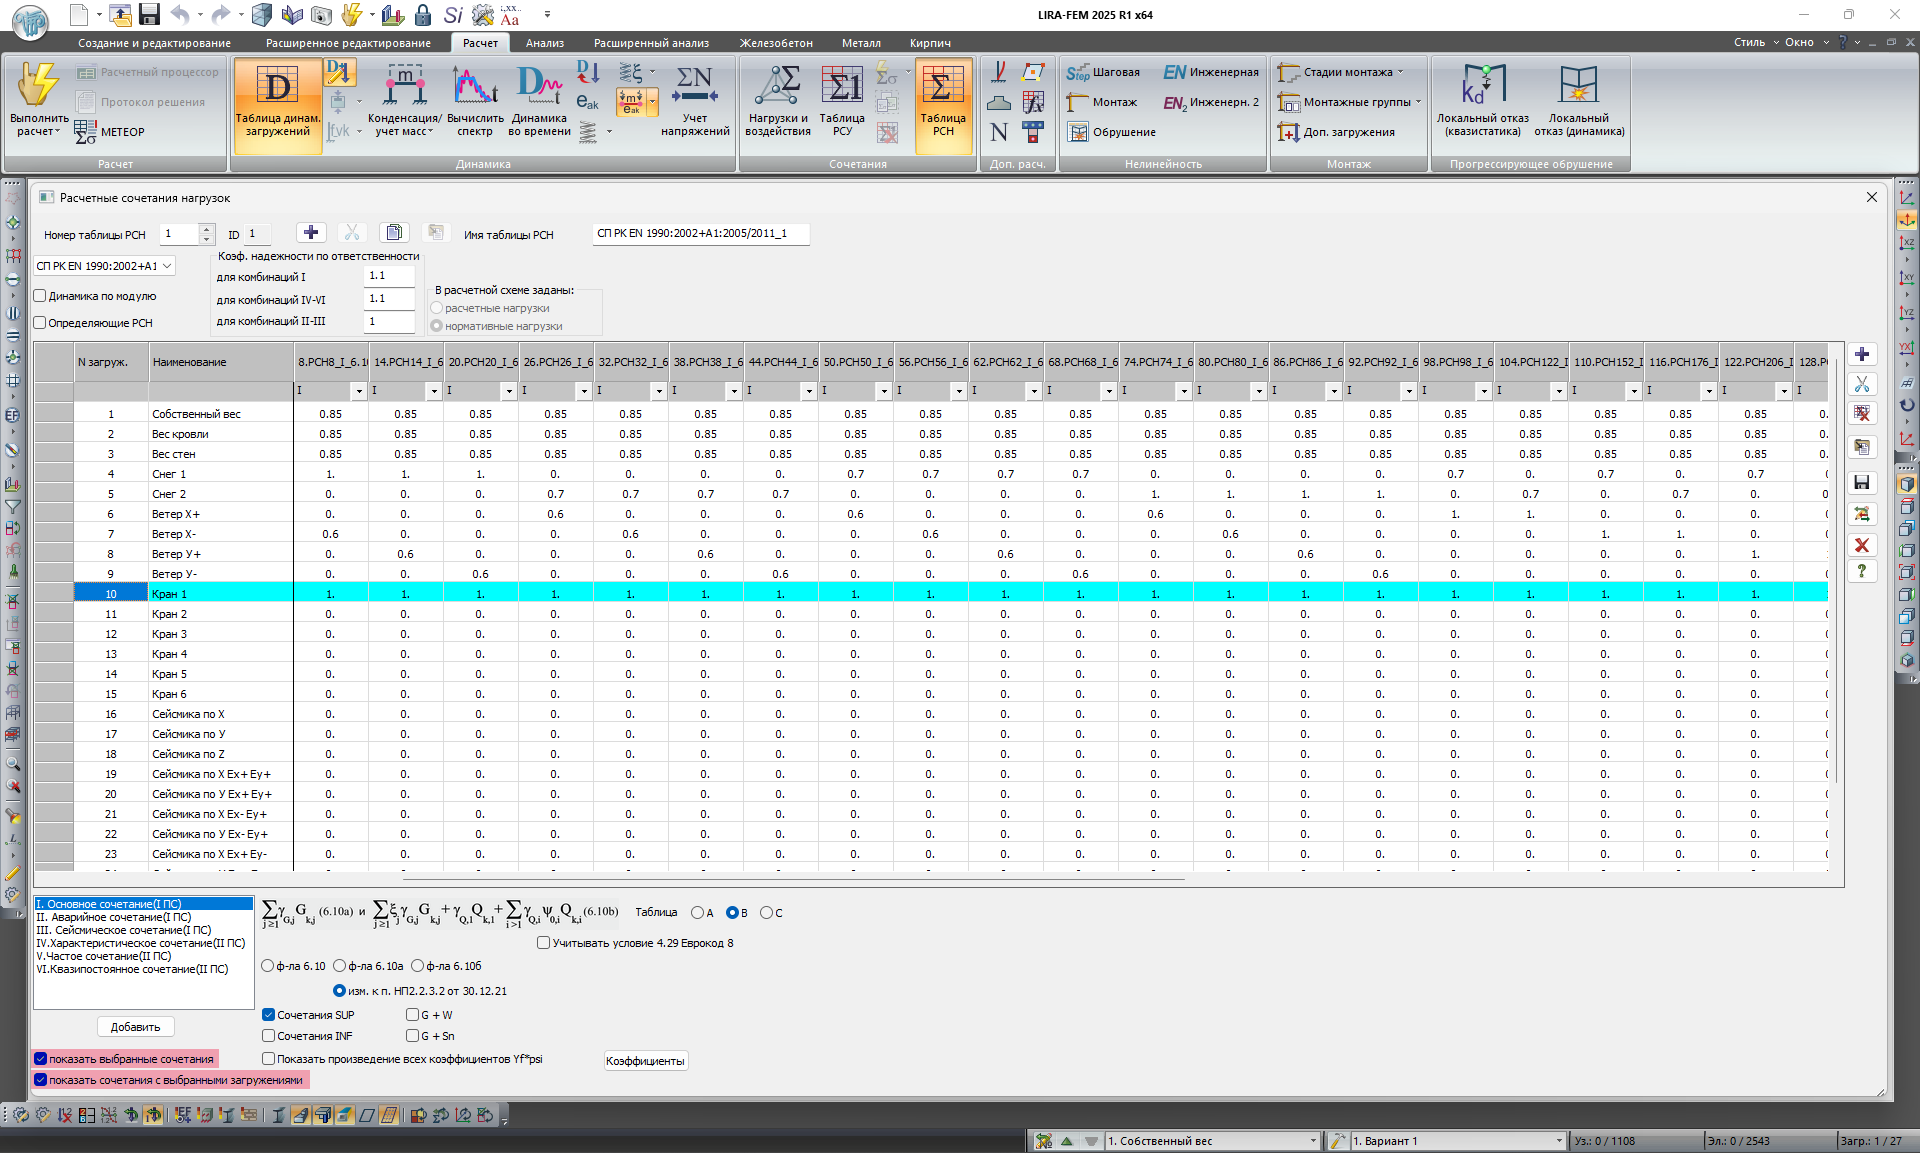
New filters are added to the DCL table to define and check the input data; they enable the user to quickly find the necessary combinations by type and content of the selected load cases.
Nonlinear volume iterative finite elements
For physically nonlinear iterative solids, the computed parameters of the stress-strain state are visualized as mosaic plots:
- relative strain εmax/εmin in the main material of solids;
- max stress σmax in the main material of solids;
- max stress in the reinforcement along X1, Y1, Z1;
- relative strain in the reinforcement along X1, Y1, Z1.
Loads on fragment
It is possible to define the data and compute loads (nodal reactions) for several groups of nodes and elements simultaneously. The new tool will greatly simplify the evaluation and documentation process. For example, this tool allows the user to obtain reactions for structural elements at the points where they are supported by other elements. In this case, different combinations of elements from which the load is collected are taken into account.
For problems with transient heat transfer analysis, the heat flow at nodes of design model may be calculated. The results can be visualized as mosaic plots and graphs of heat flow variation in time for different groups of nodes and elements.
Nonlinear hinges
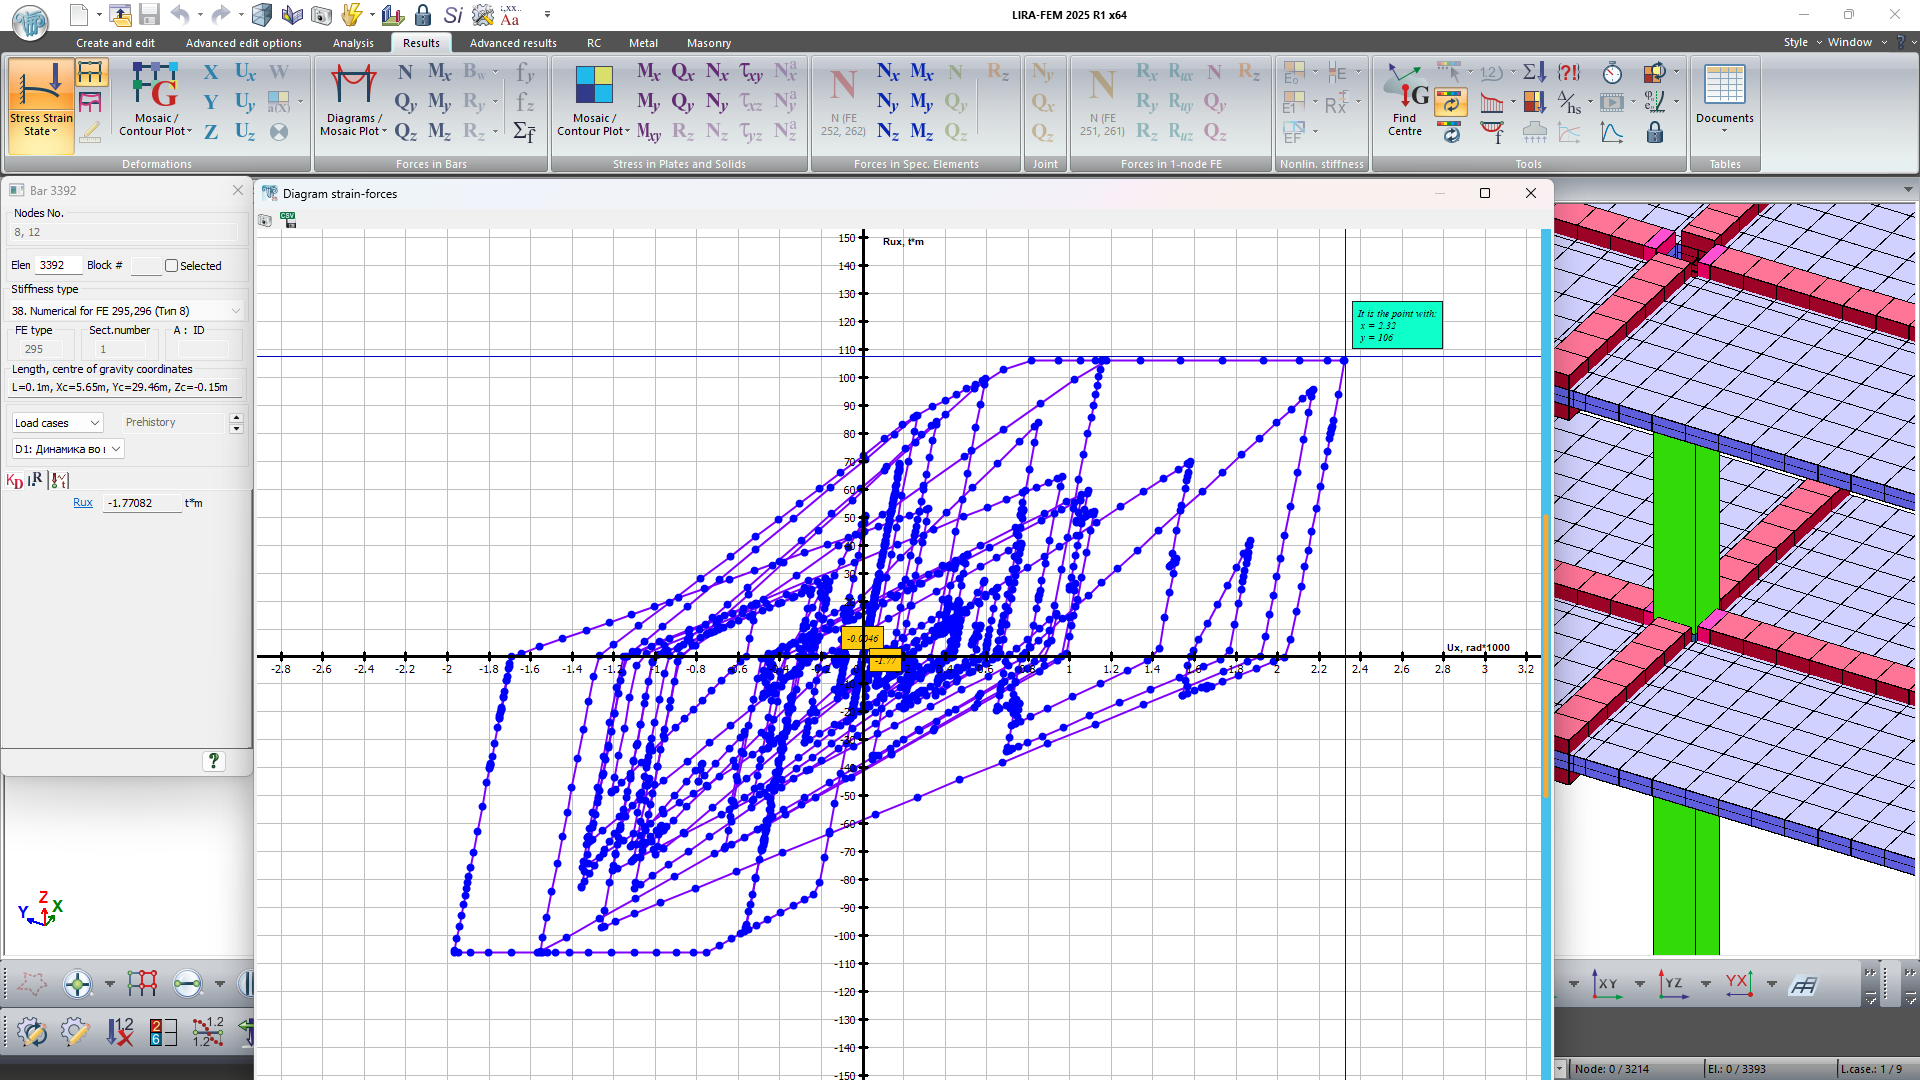
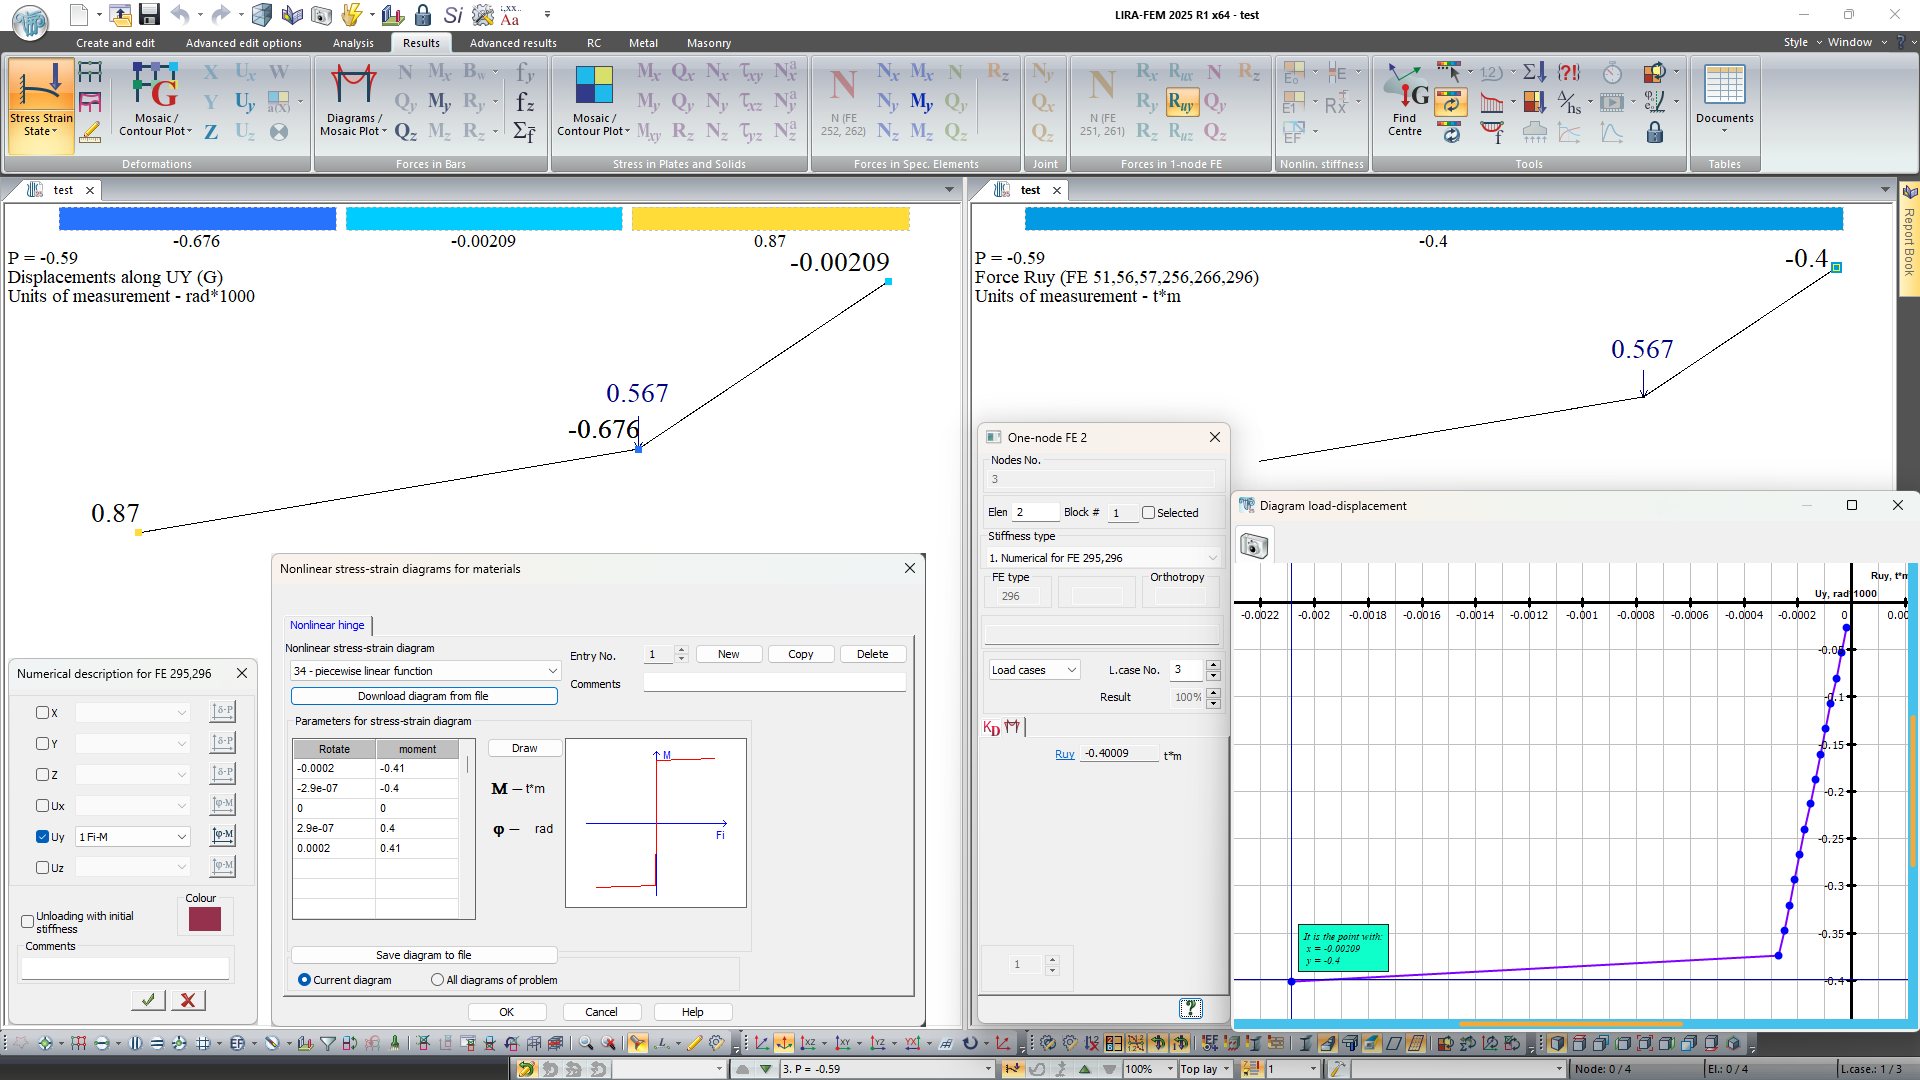
The analysis results can be used to generate "force-displacement" and "moment-rotation" graphs for two-node and one-node FEs of nonlinear elastic springs with an account of unloading with initial stiffness (FEs 295, 296). These graphs make it possible to see how nonlinear supports and nonlinear hinges behave based on loading history, which greatly enhances comprehension and evaluation of the structure's behaviour.
Tools for evaluation of object properties and analysis results
-
New modes for mosaic plots are implemented:
- A group of mosaic plots to check and prepare documentation for the specified perfectly rigid bodies: mosaic plots for the number of instances for PRB that include a node (all slave nodes of the PRB should have a value 1 on the mosaic plot, master nodes of PRB should have values of 1, 2 or more); mosaic plots for the number of nodes in all PRBs that include a node; mosaic plot of PRB types.
- A group of mosaic plots to check the loads applied to the model: mosaic plot for the number of identical loads applied to an individual node and/or element; mosaic plot for the number of loads applied to an individual node and/or element (the surface load is considered as one load); mosaic plot for loads with account of specified surface loads (uniformly distributed over the area) applied to the plates.
- A group of mosaic plots for the percentage ratio of the reinforcement area of selected/specified longitudinal reinforcement along the X, Y and XY axis (total) to the cross-sectional area of the plate.
- A group of mosaic plots for displaying and documenting the analysis results of reinforcement for bars with the type of reinforcement "Plastic wall" by SP RK EN 1998-1:2004/2012: mosaic plot for the product of confinement effectiveness factor and mechanical volumetric ratio of the confining reinforcement; mosaic plot for relative (normalized) axial force; mosaic plot for the length of boundary zone.
- A group of mosaic plots for max and min thickness values of metal shapes.
- Mosaic plots for elasticity moduli with account of defined coefficients E(E1)*kE, E2*kE , E3*kE.
- Mosaic plot for groups of mass redistribution.
- Mosaic plot for the max design compressive resistance of the soil along the Y1-axis.
- Mosaic plot for the max design compressive resistance of the soil along the Z1-axis.
- Mosaic plot for behaviour type of elastic foundation.
- Mosaic plots/diagrams for lateral-torsional moments Tw.
- Mosaic plots for plates with forces and stresses at nodes.
- Mosaic plot for the elements for which the state of the sections will be analysed.
-
New tool to select iterative physically nonlinear elements in which the state of section should be computed in analysis. In the Time History Analysis, it is possible to define the integration steps at which the analysis results for section state will be displayed (mosaic plots for normal stress, relative strain in the main material and reinforcement for the certain plate or bar; tangential stress, relative shear strain, max stress, max relative strain in the main material for the certain plate).
-
For the problems with Time History Analysis, you could generate graphs for the bimoment Bw (this moment will be computed only for the FE type 7 in problems with the model type 6) and the lateral-torsional moment Tw.
-
In the window with the output data from Pushover Analysis (monotonic increasing of horizontal earthquake load with check of horizontal displacement), there is a new option to generate a normative graph of the elastic spectrum.


