VERSION HISTORY
LIRA-FEM
Other features analysis results
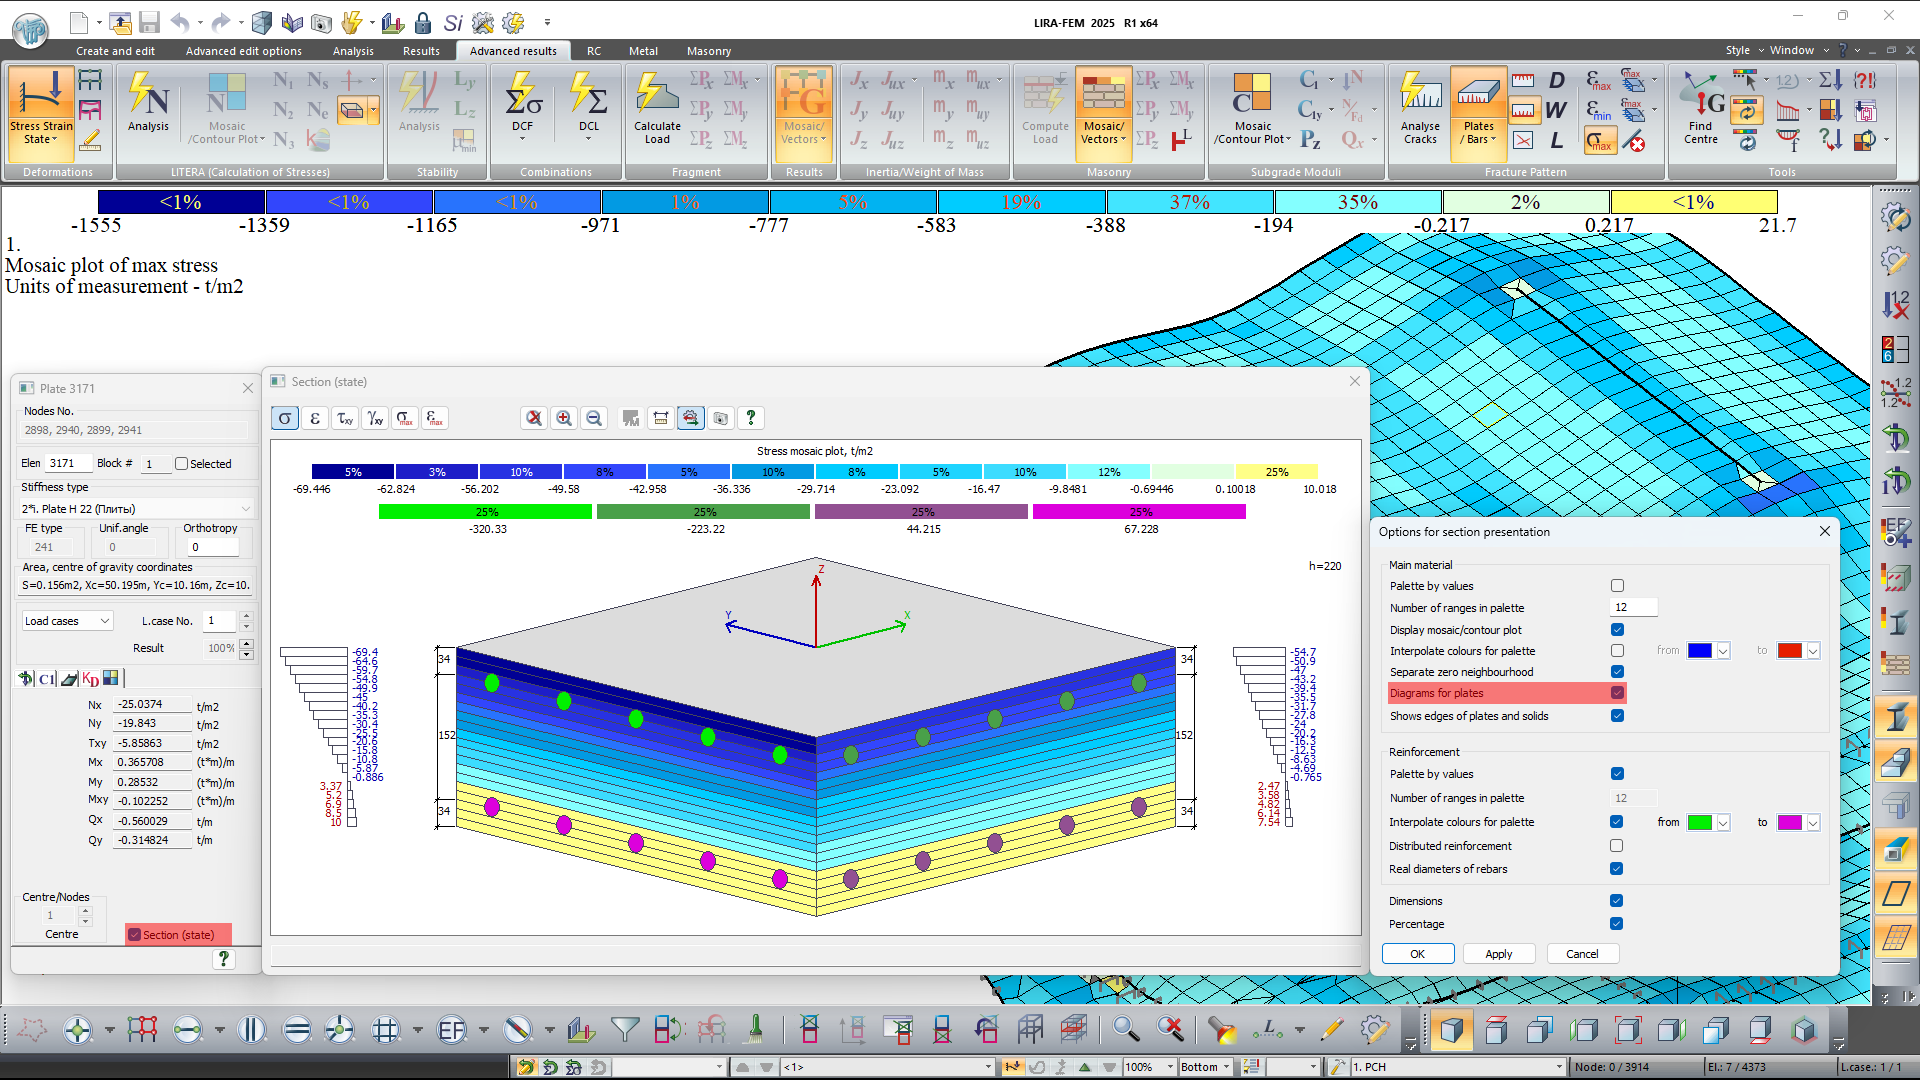
In the "State of the section" window for physically nonlinear iterated plates, it is possible to display stress and strain diagrams with indicated values for each elementary strip of the section.
New mosaic plots are implemented:
- Group of mosaic plots of total stiffnesses Rx, Ry, Rz in pile caps.
- Mosaic plot of the stability analysis results for the universal bar in metal elements, % of load-bearing capacity for Eurocode 3 EN 1993-1-1:2005/AC:2009, SP RK EN 1993-1-2:2005/2011.
- A group of mosaic plots for evaluating the input data of the problems in which the erection process was modelled (mosaic plots of assembled and disassembled elements at each assemblage stage, mosaic plot for No. of assemblage groups of elements, mosaic plot of correction factors to the modulus of elasticity and to the concrete strength at each assemblage stage for each group of elements).
- A group of mosaic plots for angles between the local axis of nodes and the global axis along selected directions.
- Mosaic plot for numbers of the specified groups of loads on fragment (the groups that contain the node).
- Mosaic plots for element sensitivity parameters to buckling.
- Mosaic plot for the direction of displacement in mass application.
- Mosaic plot for selected cross-sections of metal structures.
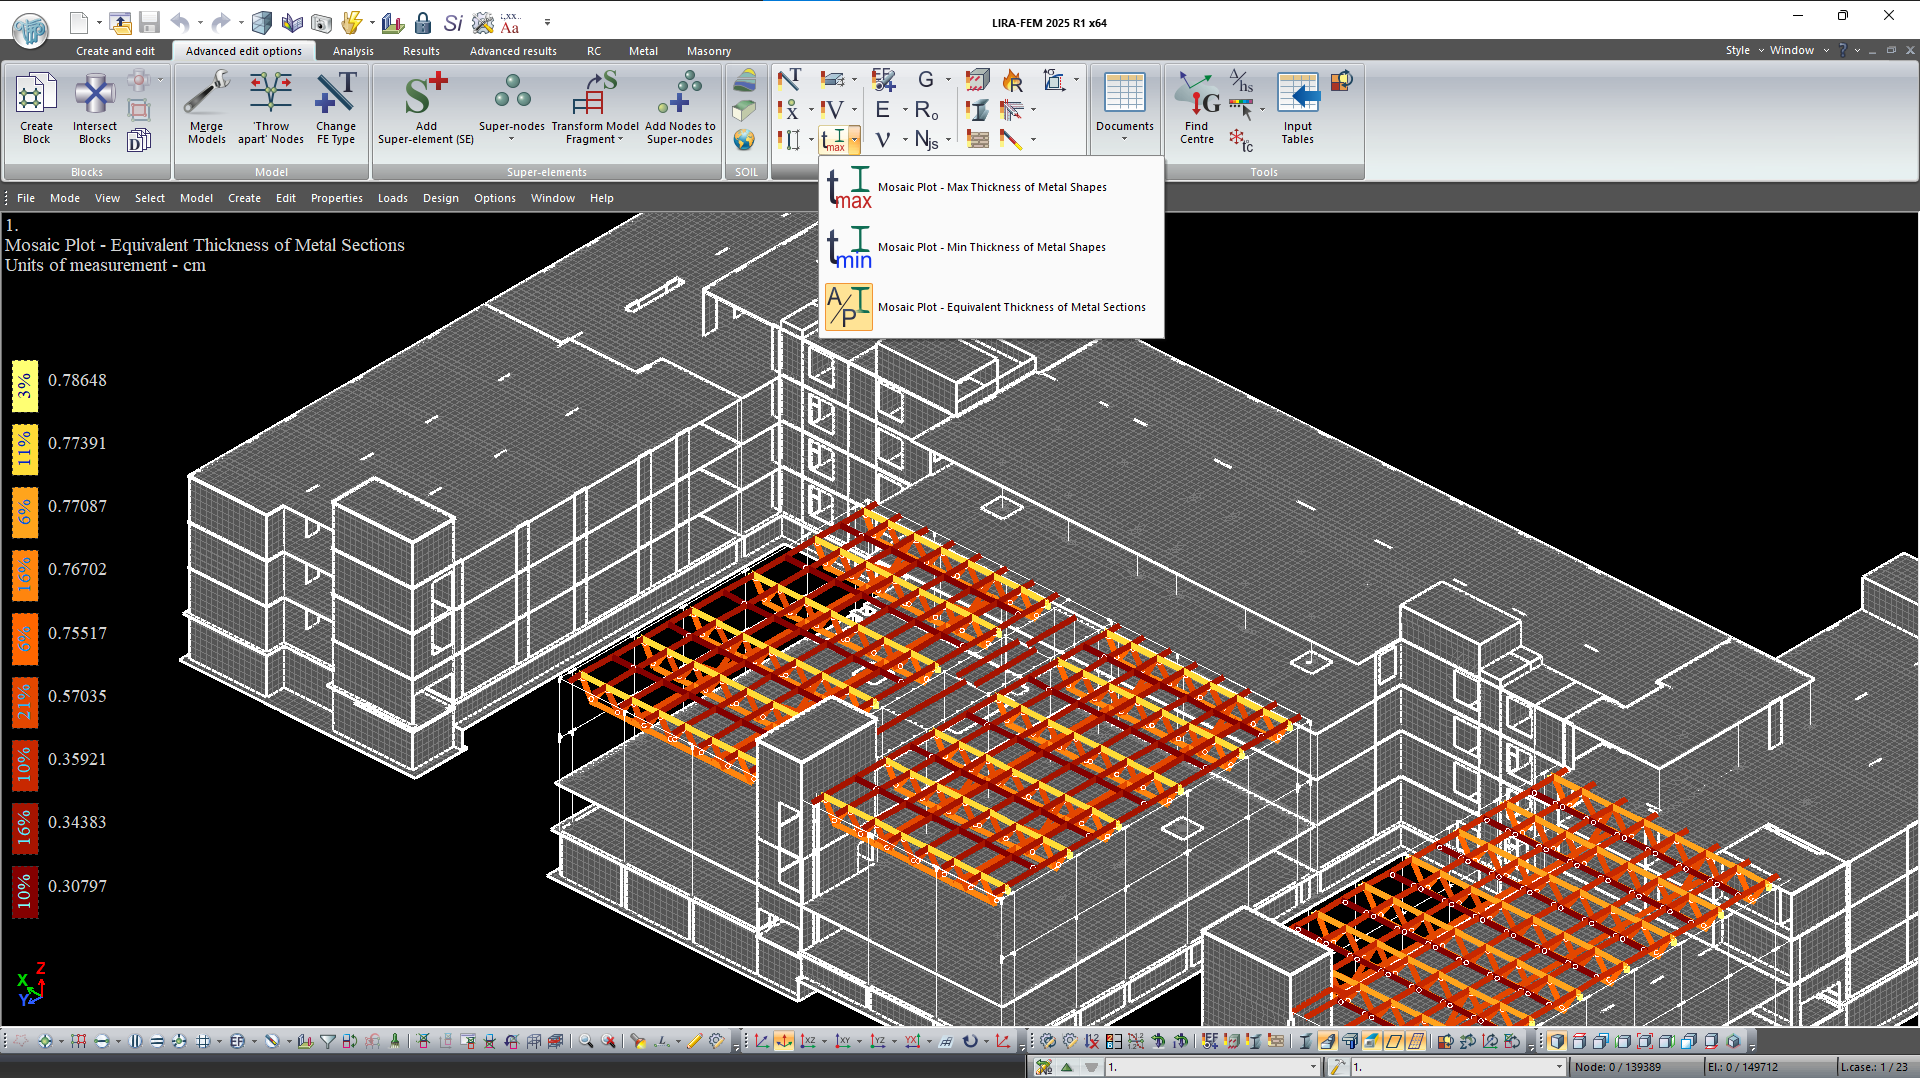
- Mosaic plot for the reduced thickness of metal sections (ratio of the cross-sectional area to the length of the perimeter of the section).
The Diagram for floor slab stiffness is generated for floor slabs both from plates and bars. The diagram is designed to classify the stiffness of the slab disc in its plane, %, according to paragraph 2.2.2.5.4 (f-la. 2.2 and 2.4) of NTP RK 08-01.2-2021 (to SP RK EN 1998-1:2004/2012) "Design of earthquake-resistant buildings".
The scale settings now contain an option that allows you to place scale labels on a transparent background.
In modes of displacement contour plots for bars, it is possible to present displacements at nodes.
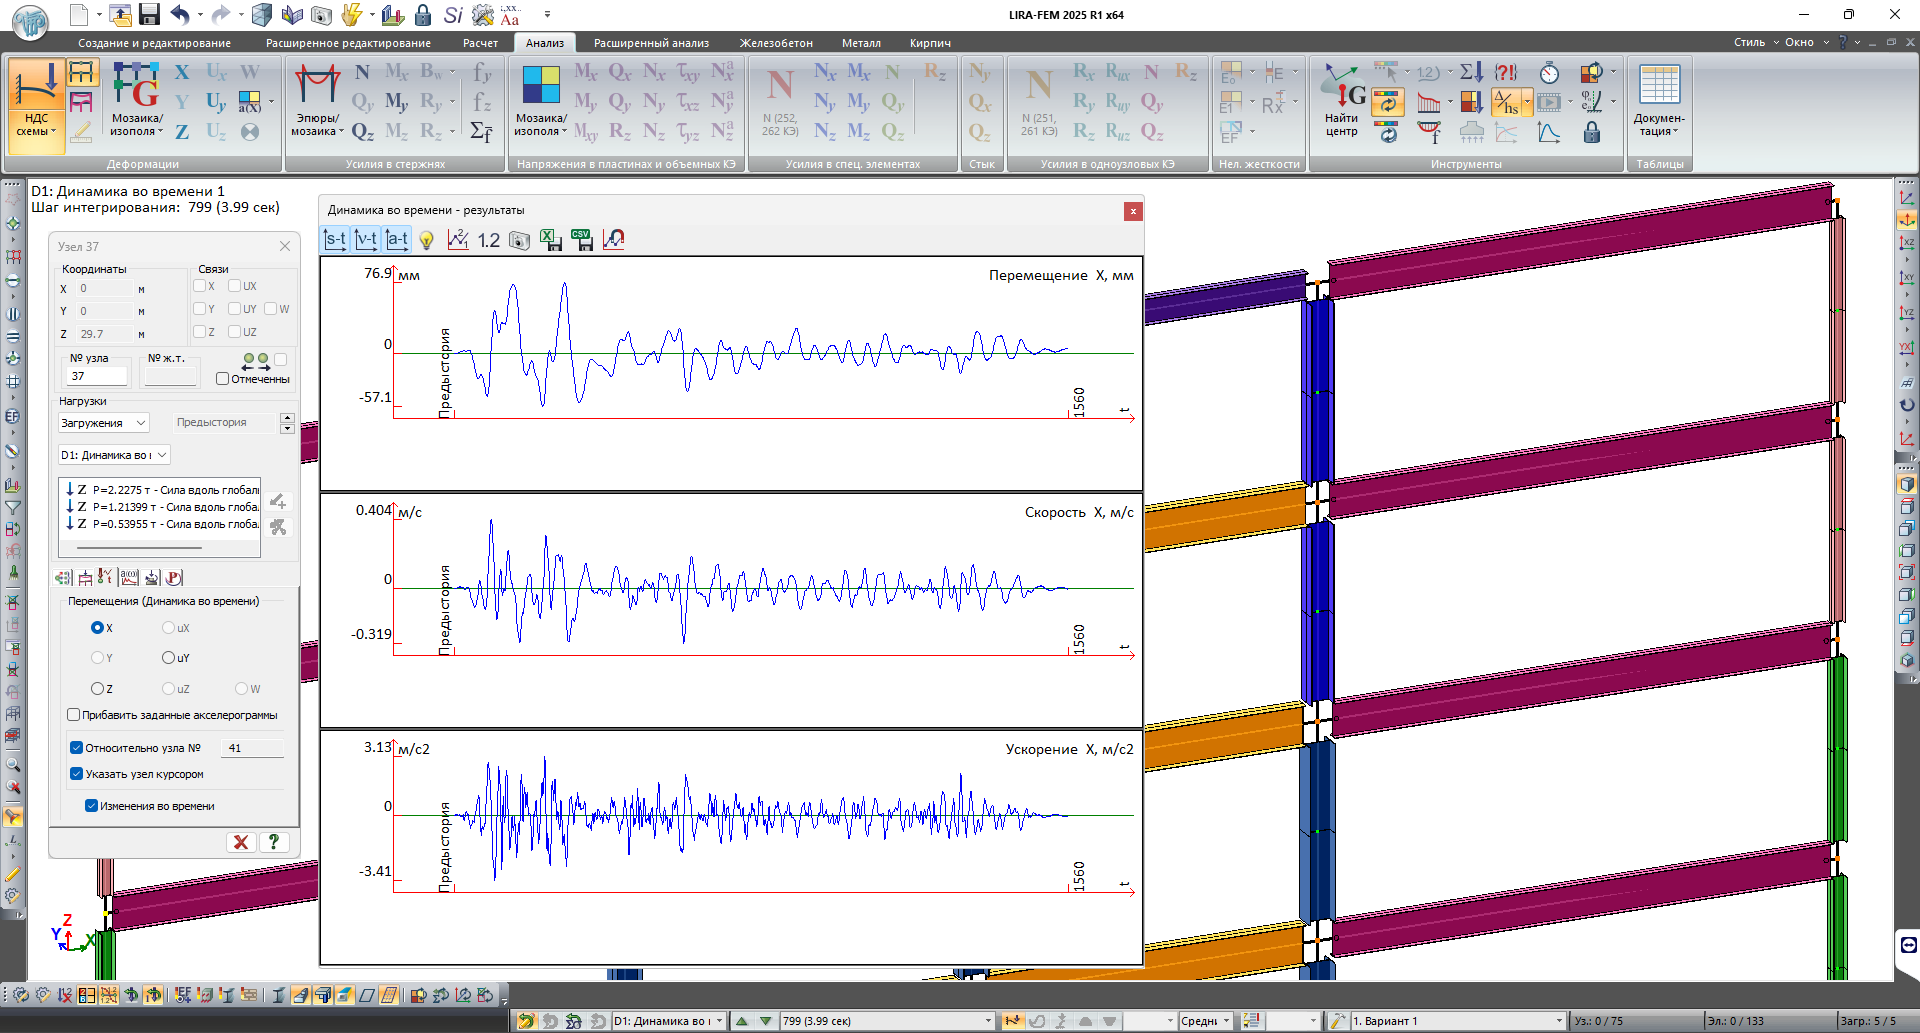
To generate the graph of nodal displacements in the time history analysis, the user could define the number of nodes relative to which the displacements are recalculated.
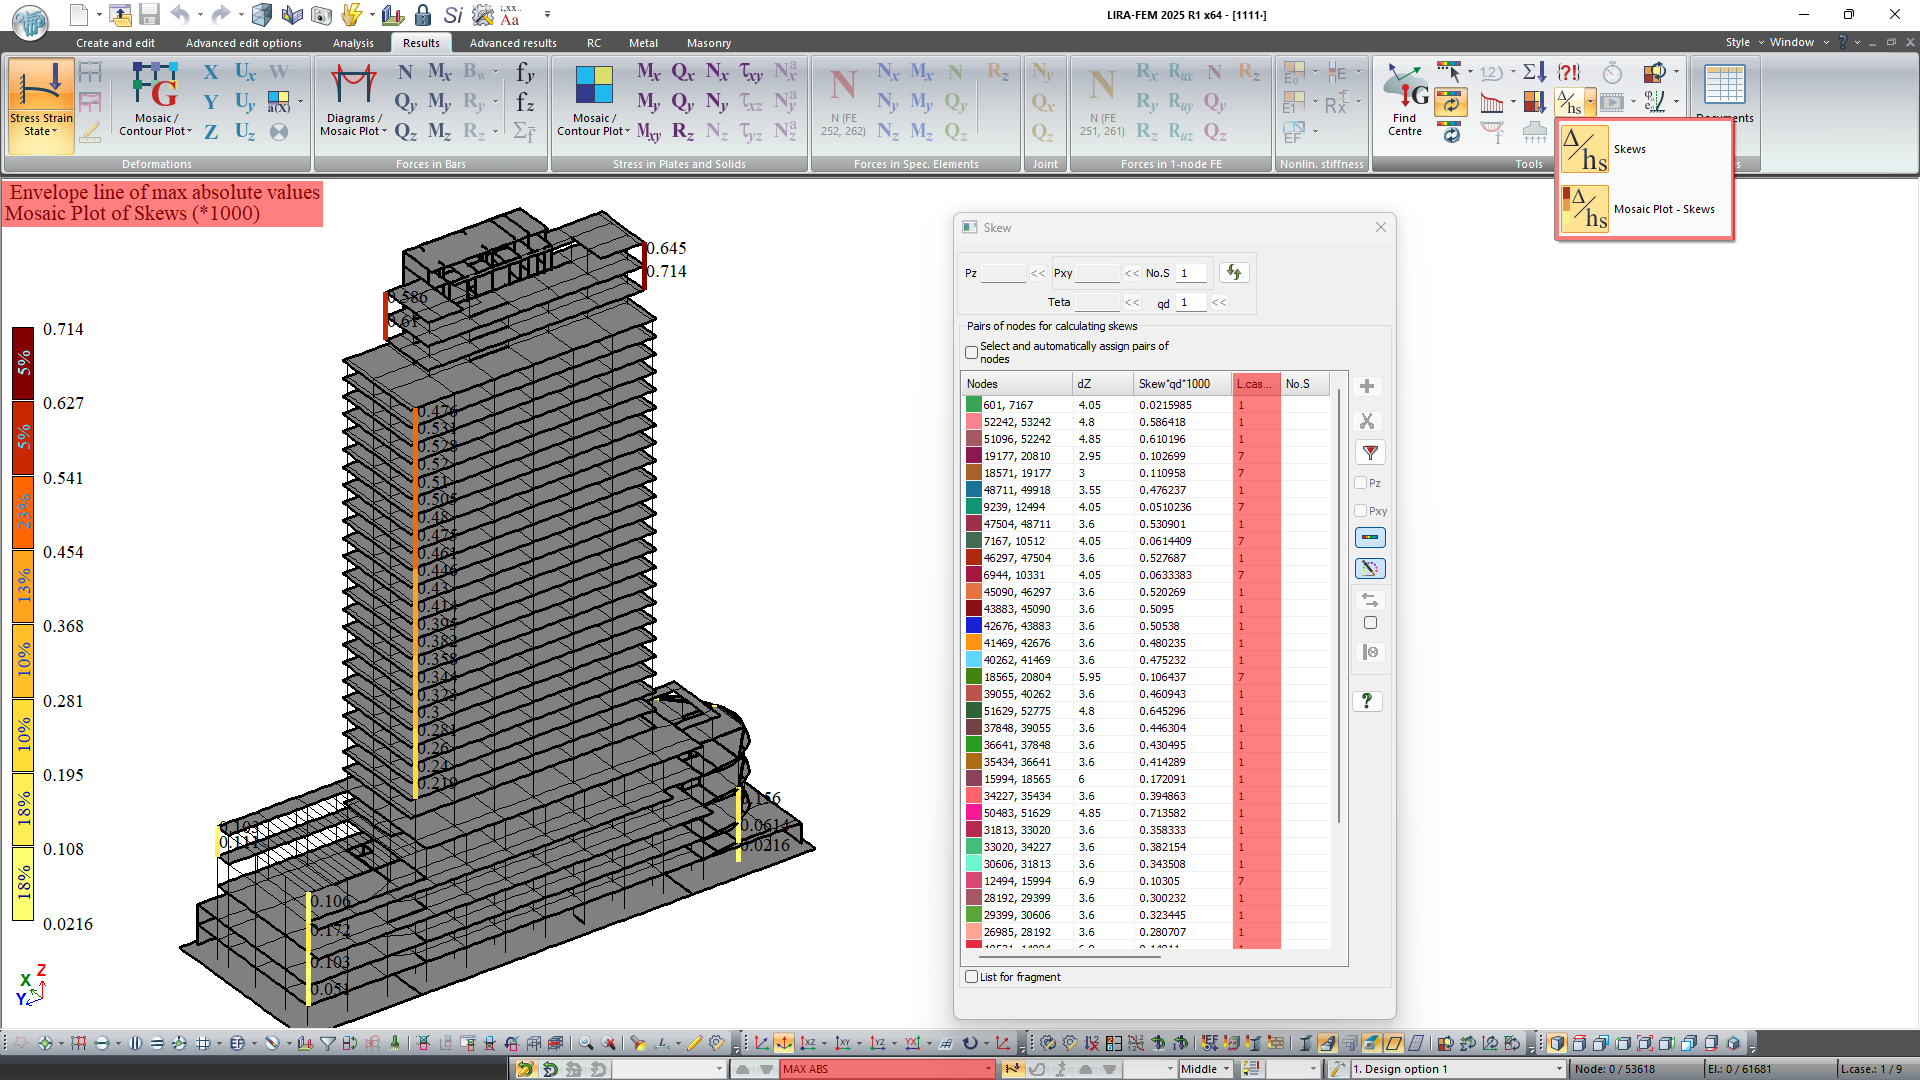
The envelope diagrams (by max, min and absolute values for load cases and DCL) may be generated for structural skews and displacement diagrams (Fz, Fy) of bars.
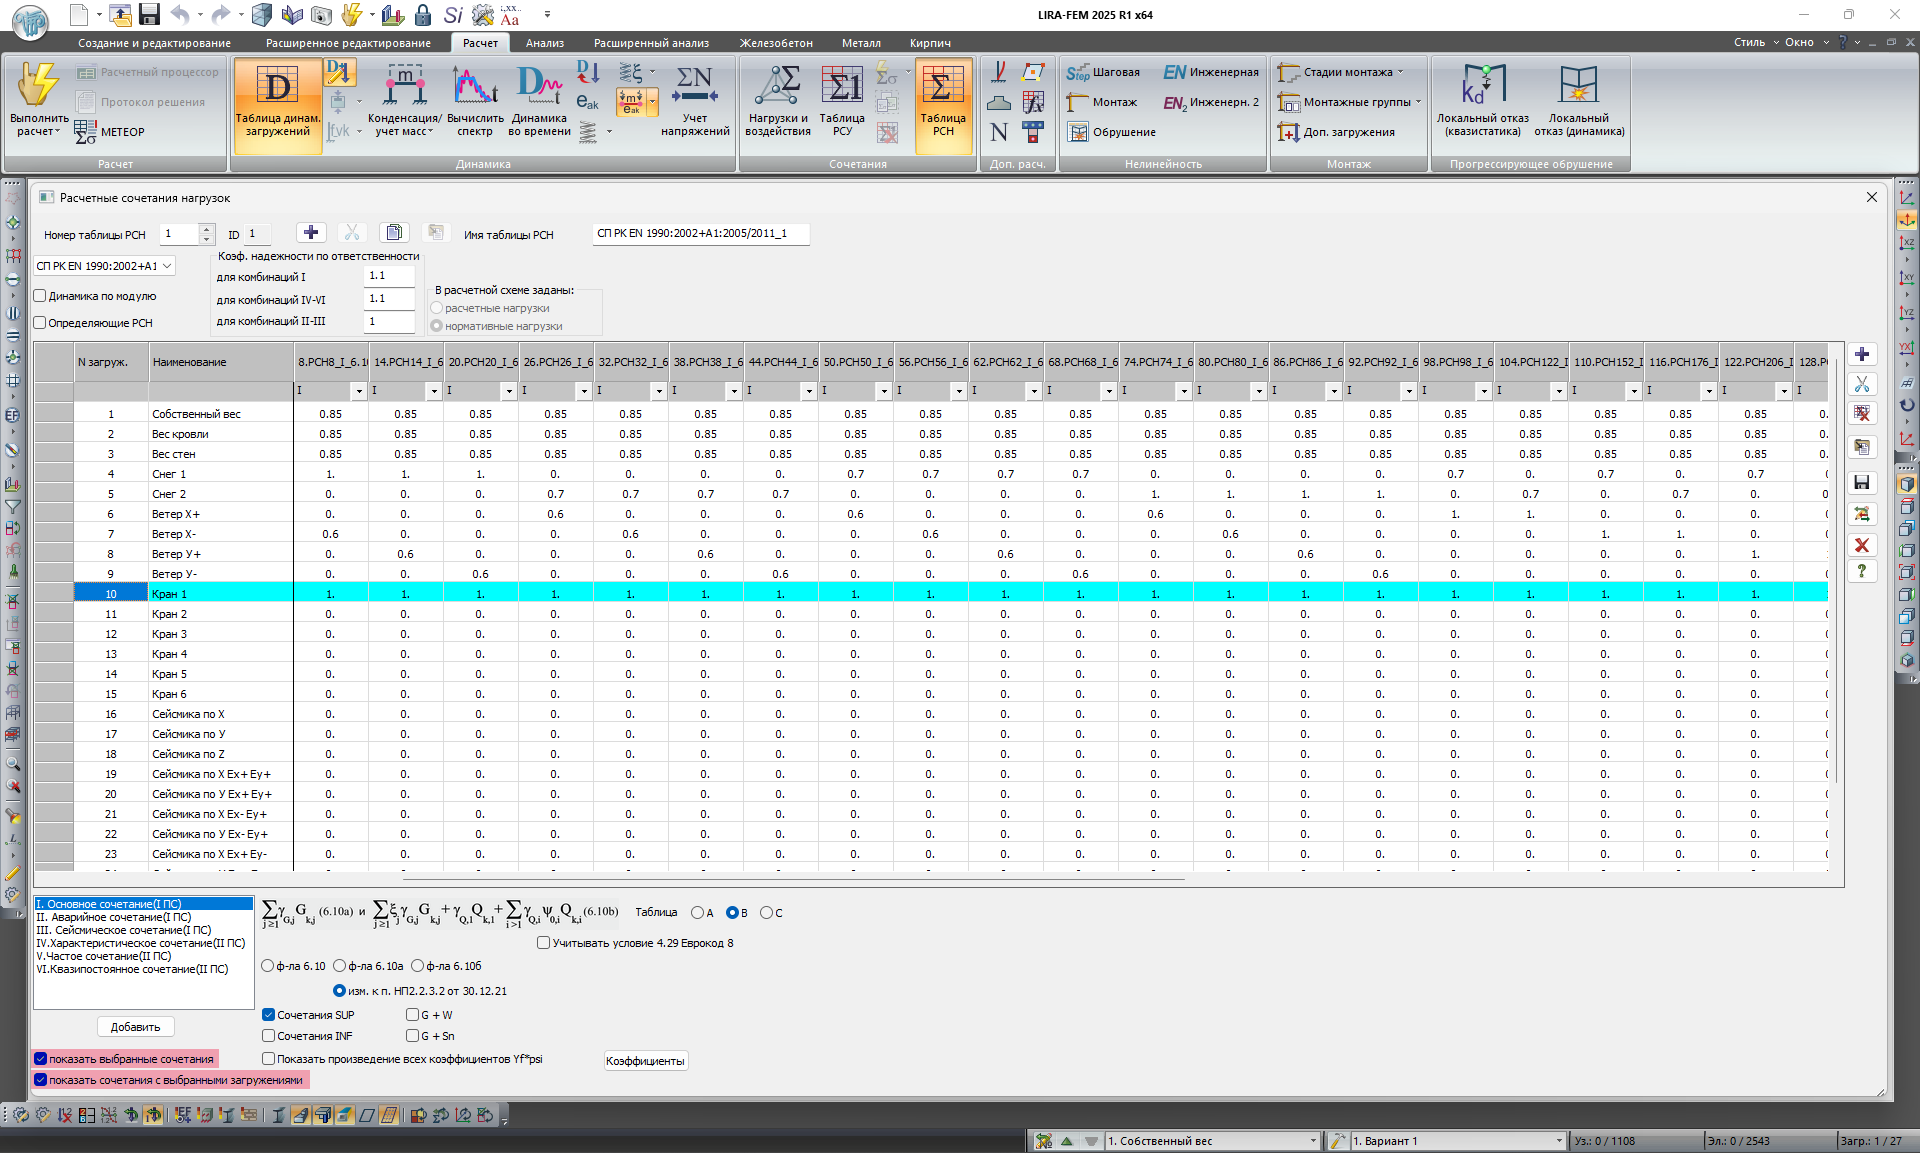
New filters are added to the DCL table to define and check the input data; they enable the user to quickly find the necessary combinations by type and content of the selected load cases.


