VERSION HISTORY
LIRA-FEM
- Components of BIM technology
- Generating and modifying the model
- Generating and modifying the design model
- Analysis options
- Tools for evaluation of object properties and analysis results
- Analysis & design of reinforced concrete (RC) structures
- RC Expert
- Analysis & design of steel structures
- Soil
- Cross-Section Design Toolkit
- Documentation improvements
Soil
-
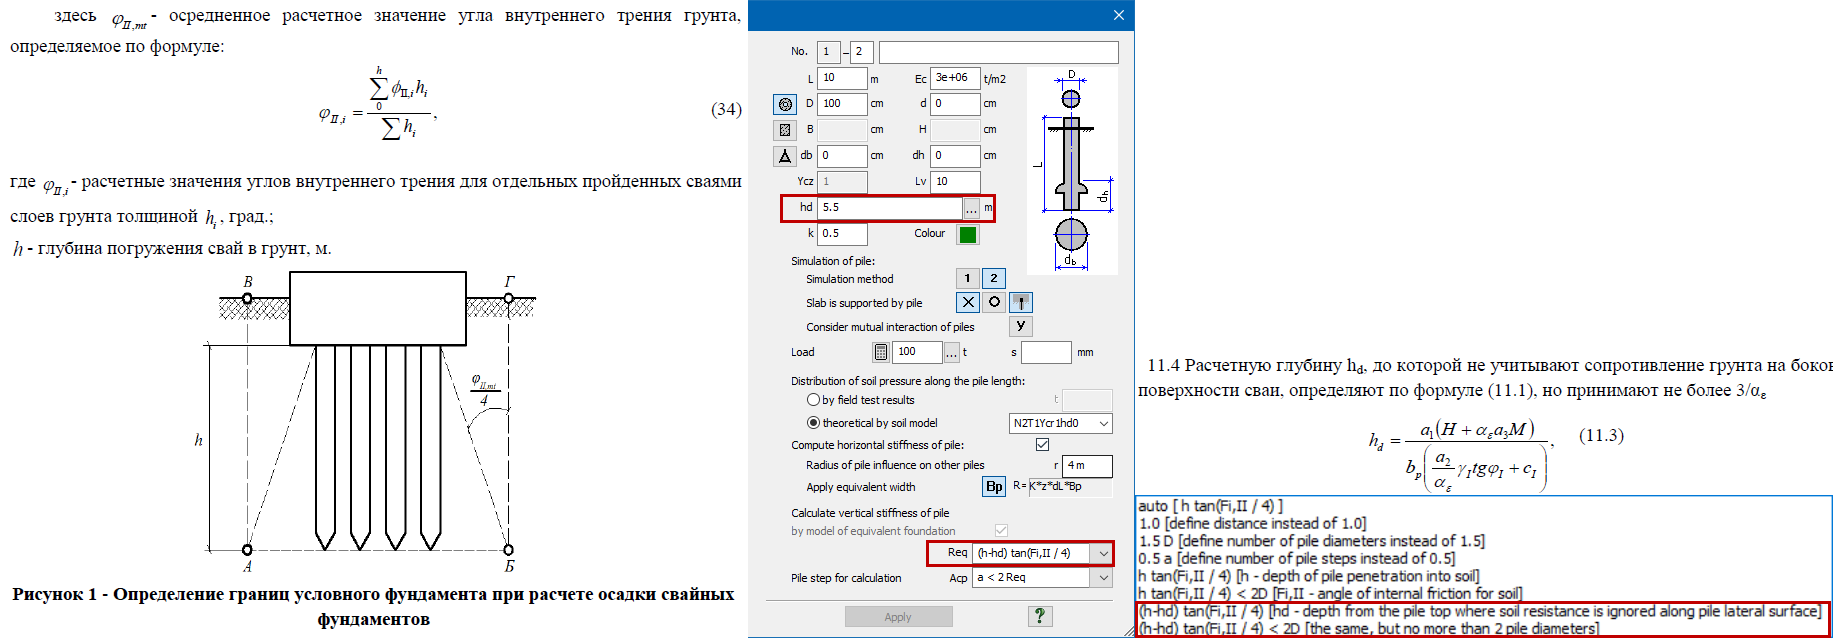
New options for generating Equivalent Foundations for piles have been implemented: when calculating Req using the formula h*tg(θII/4), where h is the depth of pile penetration into the soil, the effect of the depth hdЧat which the load-bearing capacity fi of the pileТs lateral surface is not taken into accountЧhas been added. Moreover, if the parameter Уh-hdФ results in a value of Req less than 0.5D (half the pileТs diameter), then Req is set to 0.5D.
Parameters for generating an equivalent foundation
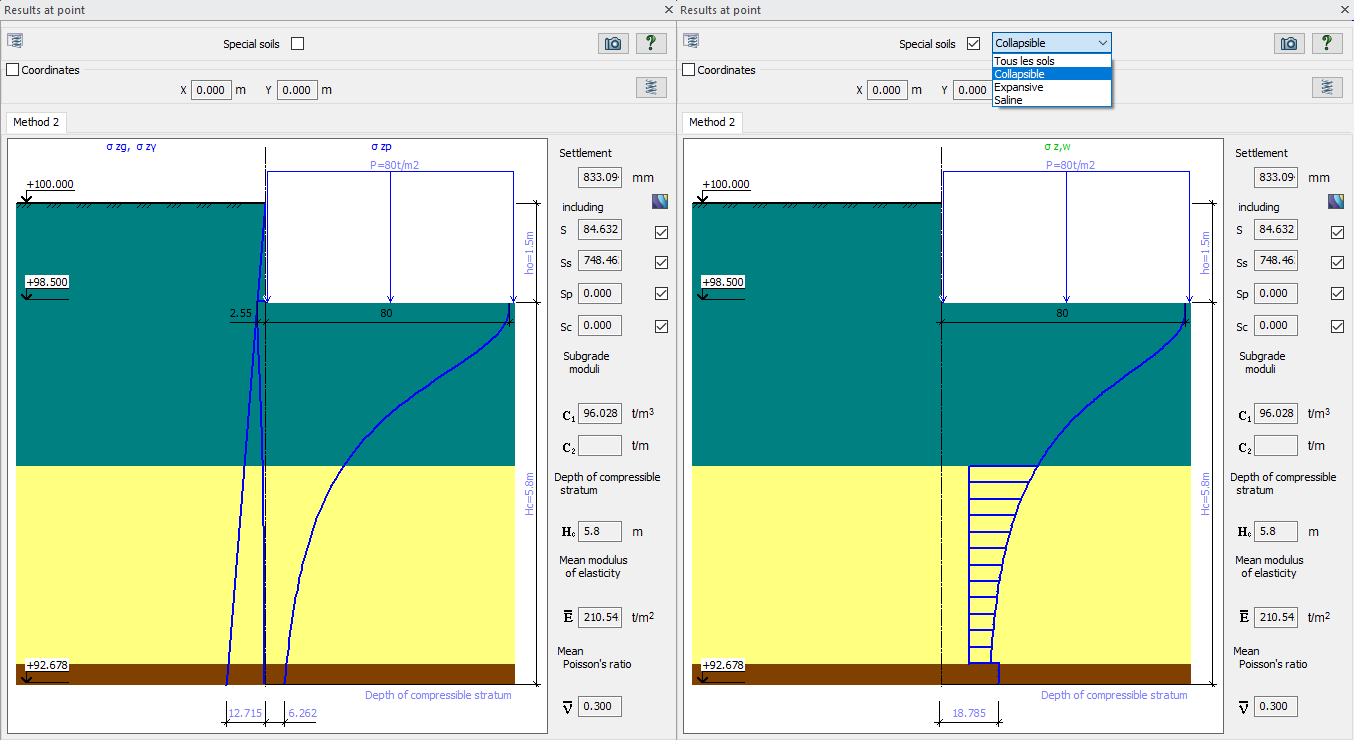
- In the "Results at a Point" dialog box, an option has been added to display calculation results for specific soils. This visualization allows for examining calculation details, serving as a partial trace of the computation. For example, for settlement soils, a hatched area of the full stress diagram Sz is shown, which contributed to the settlement calculation due to consolidation Ц clearly showing the initial settlement pressure and the extent to which the total stress Sz exceeds the initial settlement pressure layer by layer. Keep in mind that the total stress Sz includes the weight of the settlement soil with the buoyant effect of water taken into account, although in the original calculation without settlement the soil was treated as undrained (waterlogged). Thus, on the new diagram for calculating the specific soil under the foundation of the settlement layer, a jump in stresses is visible that is absent in the calculation without settlement.
Stress diagram for analysis of specific soil
- In the scale settings, an option has been added to display percentages in the scale ranges Ц indicating what fraction of the original data points and computation results fall within the given range.
- In the legend (textual accompaniment) for the calculation results (settlement and subgrade coefficients), the average value calculated from all load contours is now displayed.


